Finite Element Analysis
When finding the modes of vibration of a structure, having computer modeling and analysis as a tool is extremely helpful. Not only can methods like finite element analyis find the modes of vibration of structures too complex or expensive to experiment on, but they can also serve as sanity checks for simpler experiments, to ensure that the real world results are not wildly different from what is expected. Finite Element Analysis is a numerical method in which a computer program subdivides a modeled structure into many small parts (finite elements) and solves the differential equations that govern the properties and reactions of those elements. It then assembles these subdivisions back together and outputs the effects of your analysis of the structure. In my research I used two types of analyses: Eigenfrequency analysis and Implicit Dynamic analysis.
Eigenfrequency Analysis:
Eigenfrequency analyses are extremely useful for finding and visualizing the modes of vibration of a structure. Finding the eigenvalues of a global stiffness matrix of a structure yields the frequencies of the modes of vibration, and the corresponding eigenvectors describe the deflection of the structure at a mode. Due to the relative simplicity of this calculation, the eigenfrequency analysis is very fast. Using this analysis, I am able to quickly and accurately inspect several modes of vibration of multiple different boundary condition configurations of a structure. The animation yielded by an eigenfrequency analysis is a looped animation of the structure reaching maximum deflection of a specific modal shape.
Natural mode of a cantilevered beam, found through an Eigenfrequency analysis
Implicit Dynamic Analysis:
While an eigenfrequency analysis computes only the global stiffness matrix to derive the modes of vibration, the implicit dynamic method analyzes over a specified time frame, taking into account the state of the model in the previous time iteration. This means that the analysis considers data such as inertia and damping due to boundary conditions, data that an eigenfrequency analysis doesn’t deal with. Since getting a decent view of what happens to a structure requires a lot of time steps, this method crunches through a lot of data and ends up taking a long time for an analysis (my longest analysis took about 10 hours). The benefit of this long wait, however, is that you can see how a structure actually reacts through time. You can see how the waves propagate through an object after impact!
Due to the long computation time of the method, I reserve using implicit dynamic analyses for cases where the model was too complex for the eigenfrequency analysis to output vibrational modes. For example, this bridge in the animation below is too complex for an eigenfrequency analysis to give accurate insight into the modes of vibration. Thus, I perform an implicit dynamic analysis and analyze the virtual data to find that the frequency of natural mode of vibration is around 10.3 Hz.
Unlike the eigenfrequency method, however, the implicit dynamic method doesn’t spit out the frequencies of the vibrational modes of the structure. In order to find these frequencies, I output the displacement time history data of a specific point, just like how I would put a sensor in a specific location if I were to do this experiment in real life. Once this data is outputted, I perform a Fourier transform to find the modes. This turns my FEA model into a virtual experiment which provides data that I can analyze just like I would a real experiment.
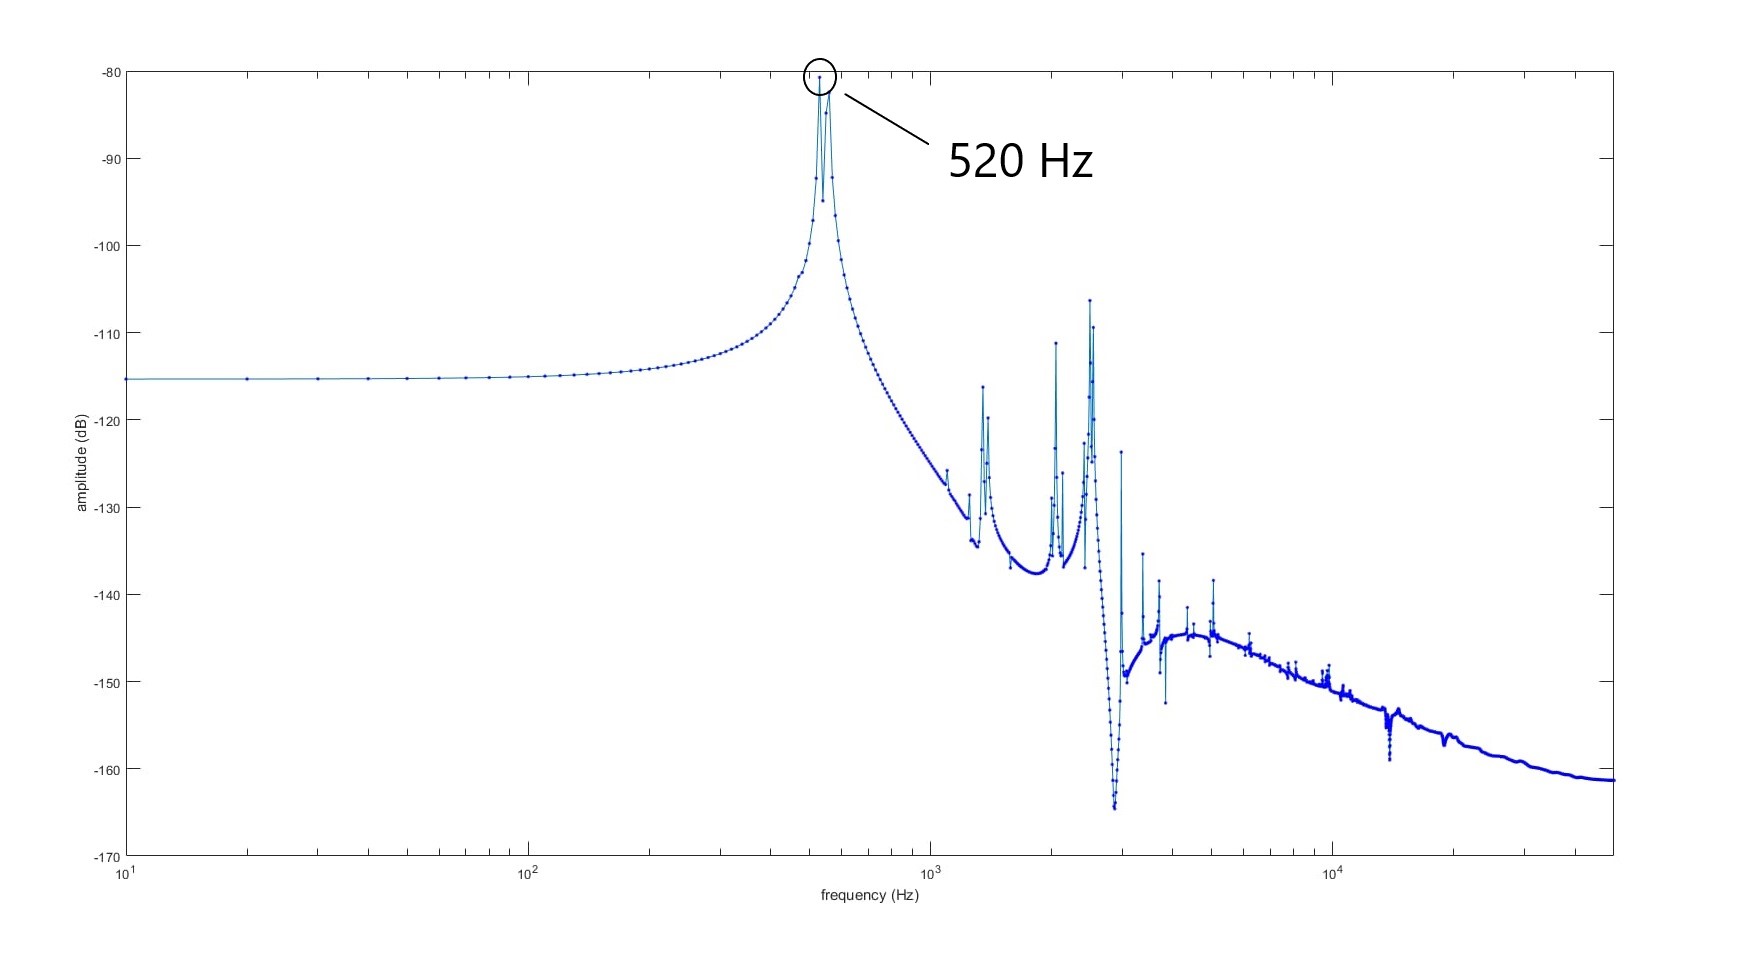
The graph above shows the Fourier transform of data collected from an implicit dynamic analysis of the hollow rectangular structure in the animation shown above. Based on the peaks of the graph, we can deduce that the first mode of vibration of the structure is around 520 Hz.
To learn more about Fourier transfroms, click the link below: