Fourier Transforms
When finding the vibrational modes of a structure, the Fourier Transform proves to be perhaps the most useful tool of all. When performed on a data set of the vibrations in a structure, the Fourier Transform breaks apart the jumble of data and reveals the most prevalant frequencies.
In short, the method breaks apart any signal into a set of sinusoids, each with their own frequency, amplitude, and phase shift. By themselves, each sinusoid looks just like that: a sinusoid. However, when combined, the different paths constructively and destructively interfere, resulting in a complex signal.
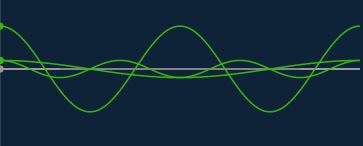
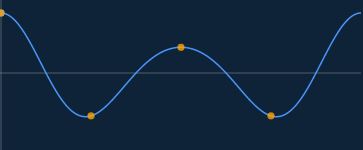
The above image shows a 1 Hz sinusoid of some arbitrary amplitude 1, a 2 Hz sinusoid of amplitude 5, and a 3 Hz sinusoid of amplitude 1. Though completely different, when the three sinusoids are combined, they result in the following:
Images courtesy of Better Explained
The Fourier Transfrom performs this process in reverse. It starts with some complex signal, such as the vibrations in a structure, and filters this data into a series of sinusoids, such as the ones shown in the first picture. The transform then plots this information on an amplitude vs frequency graph, which tells us which frequency was responsible for the most activity in the original signal. For example, the data set below is the vibrational signal of a cantilevered piece of solid steel.
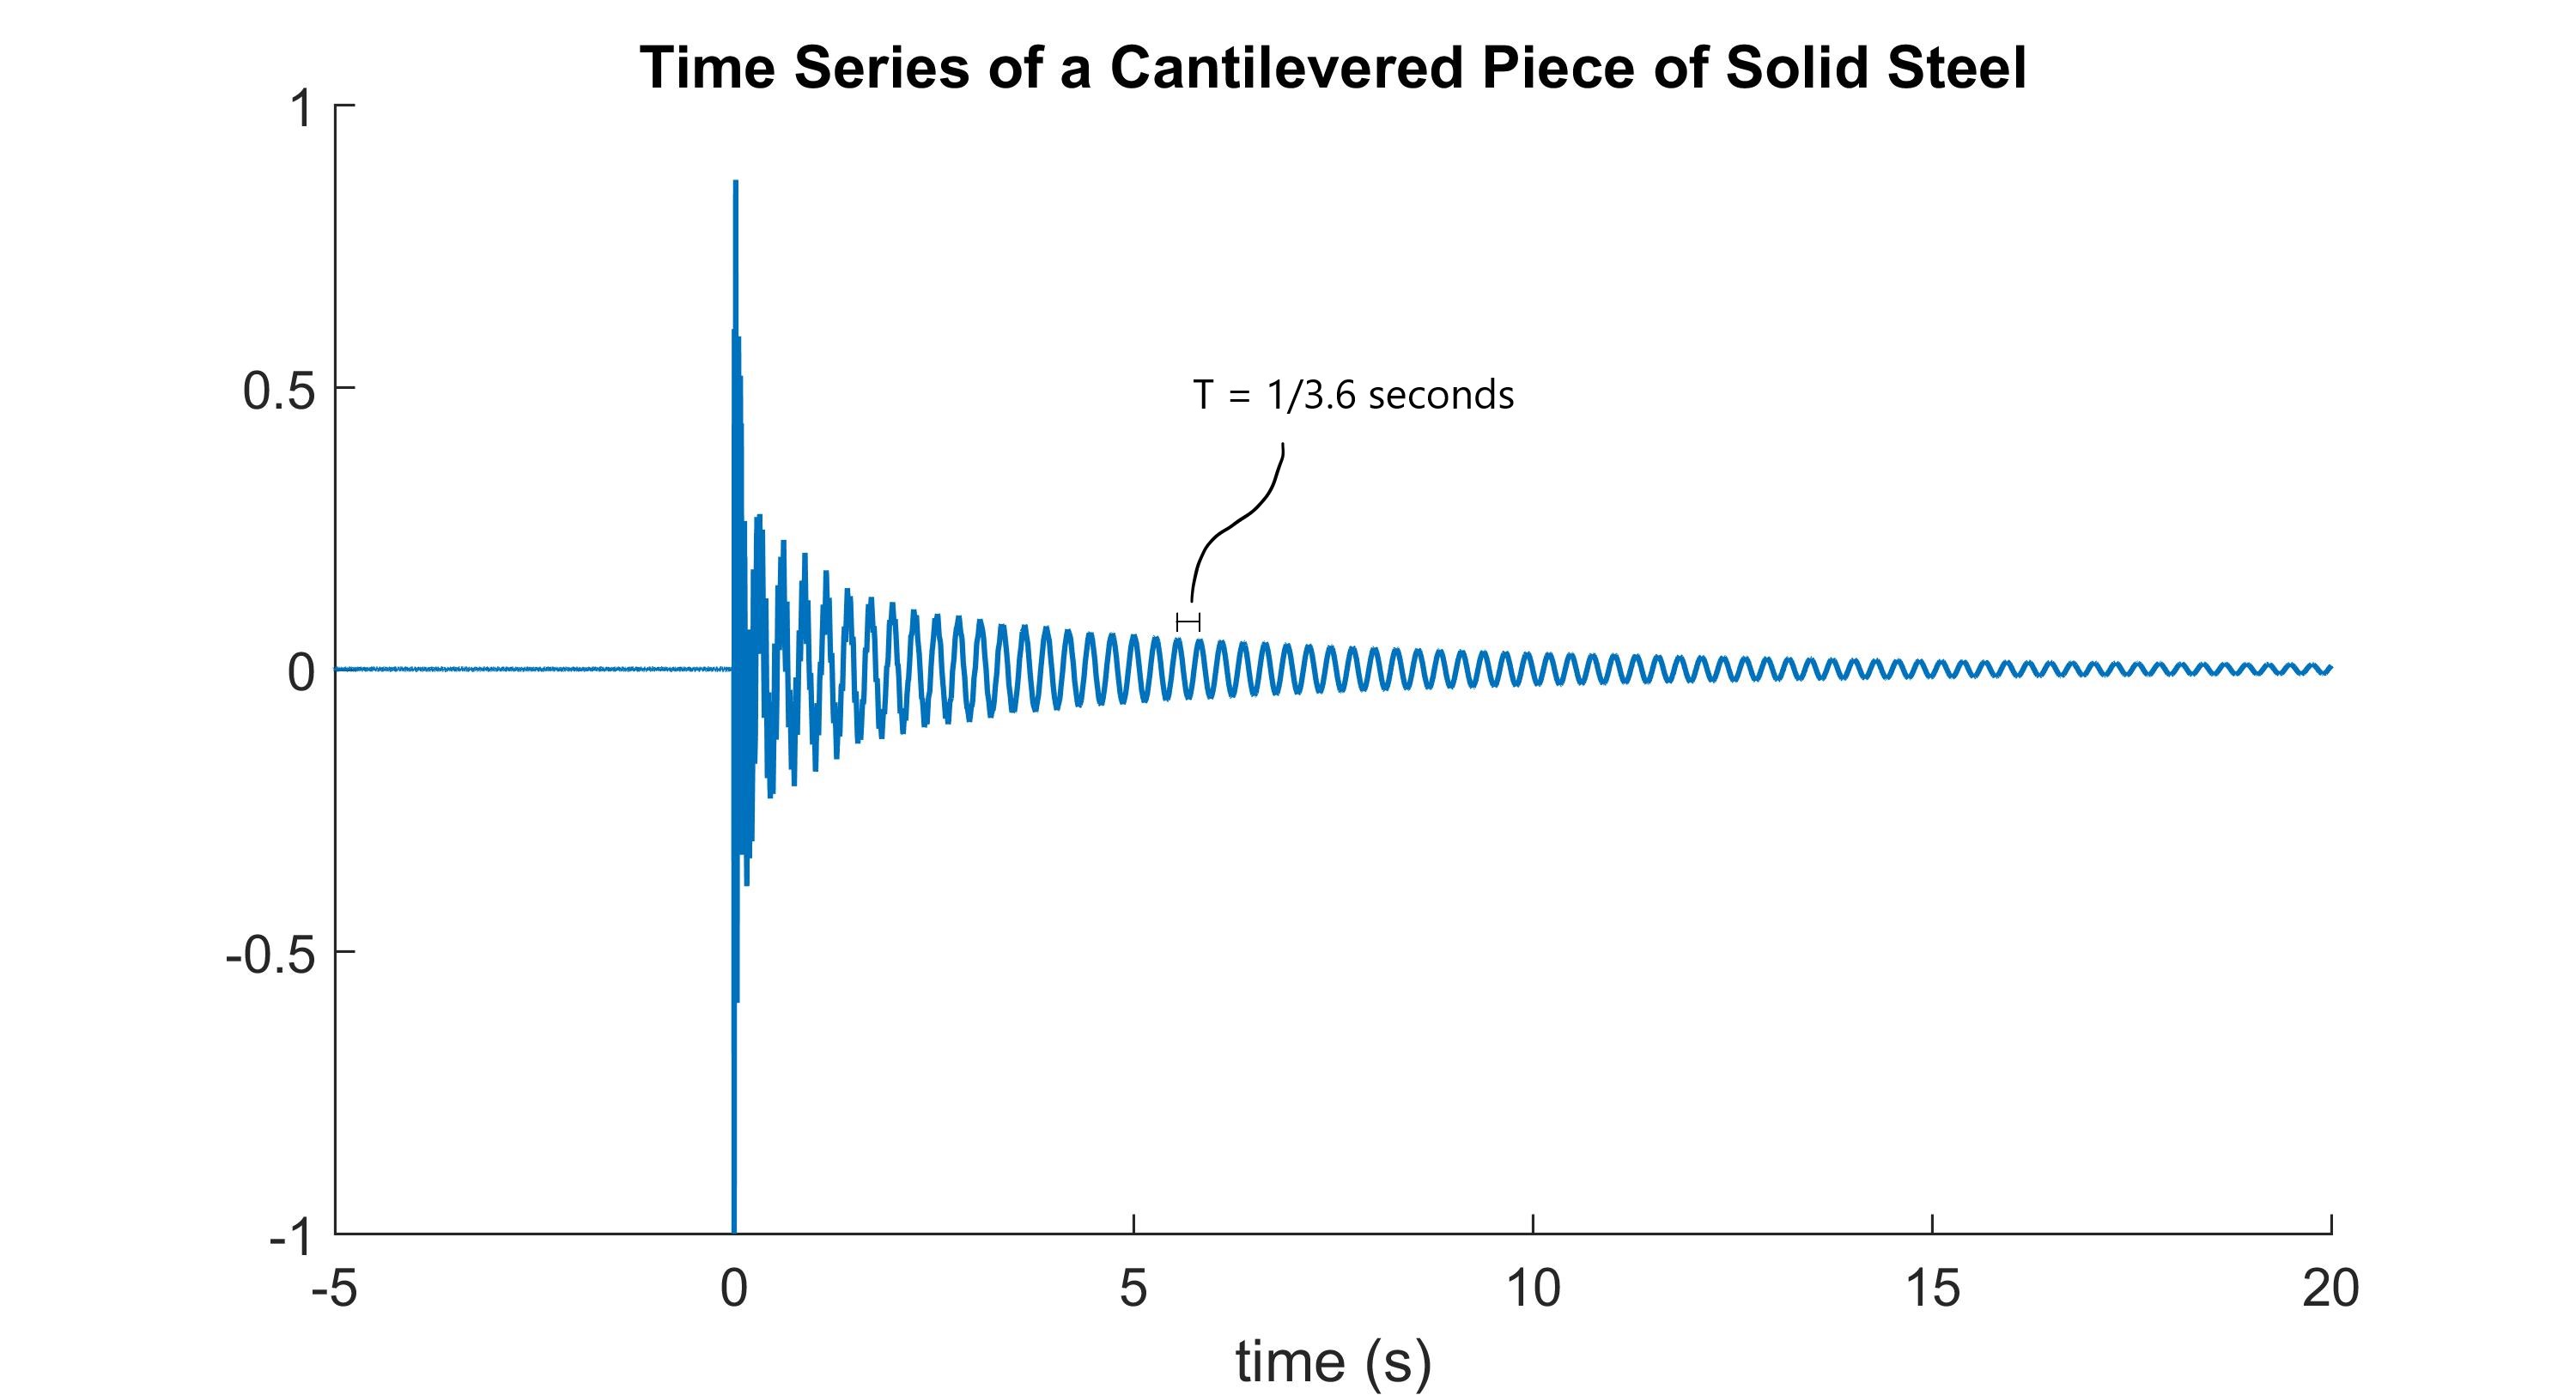
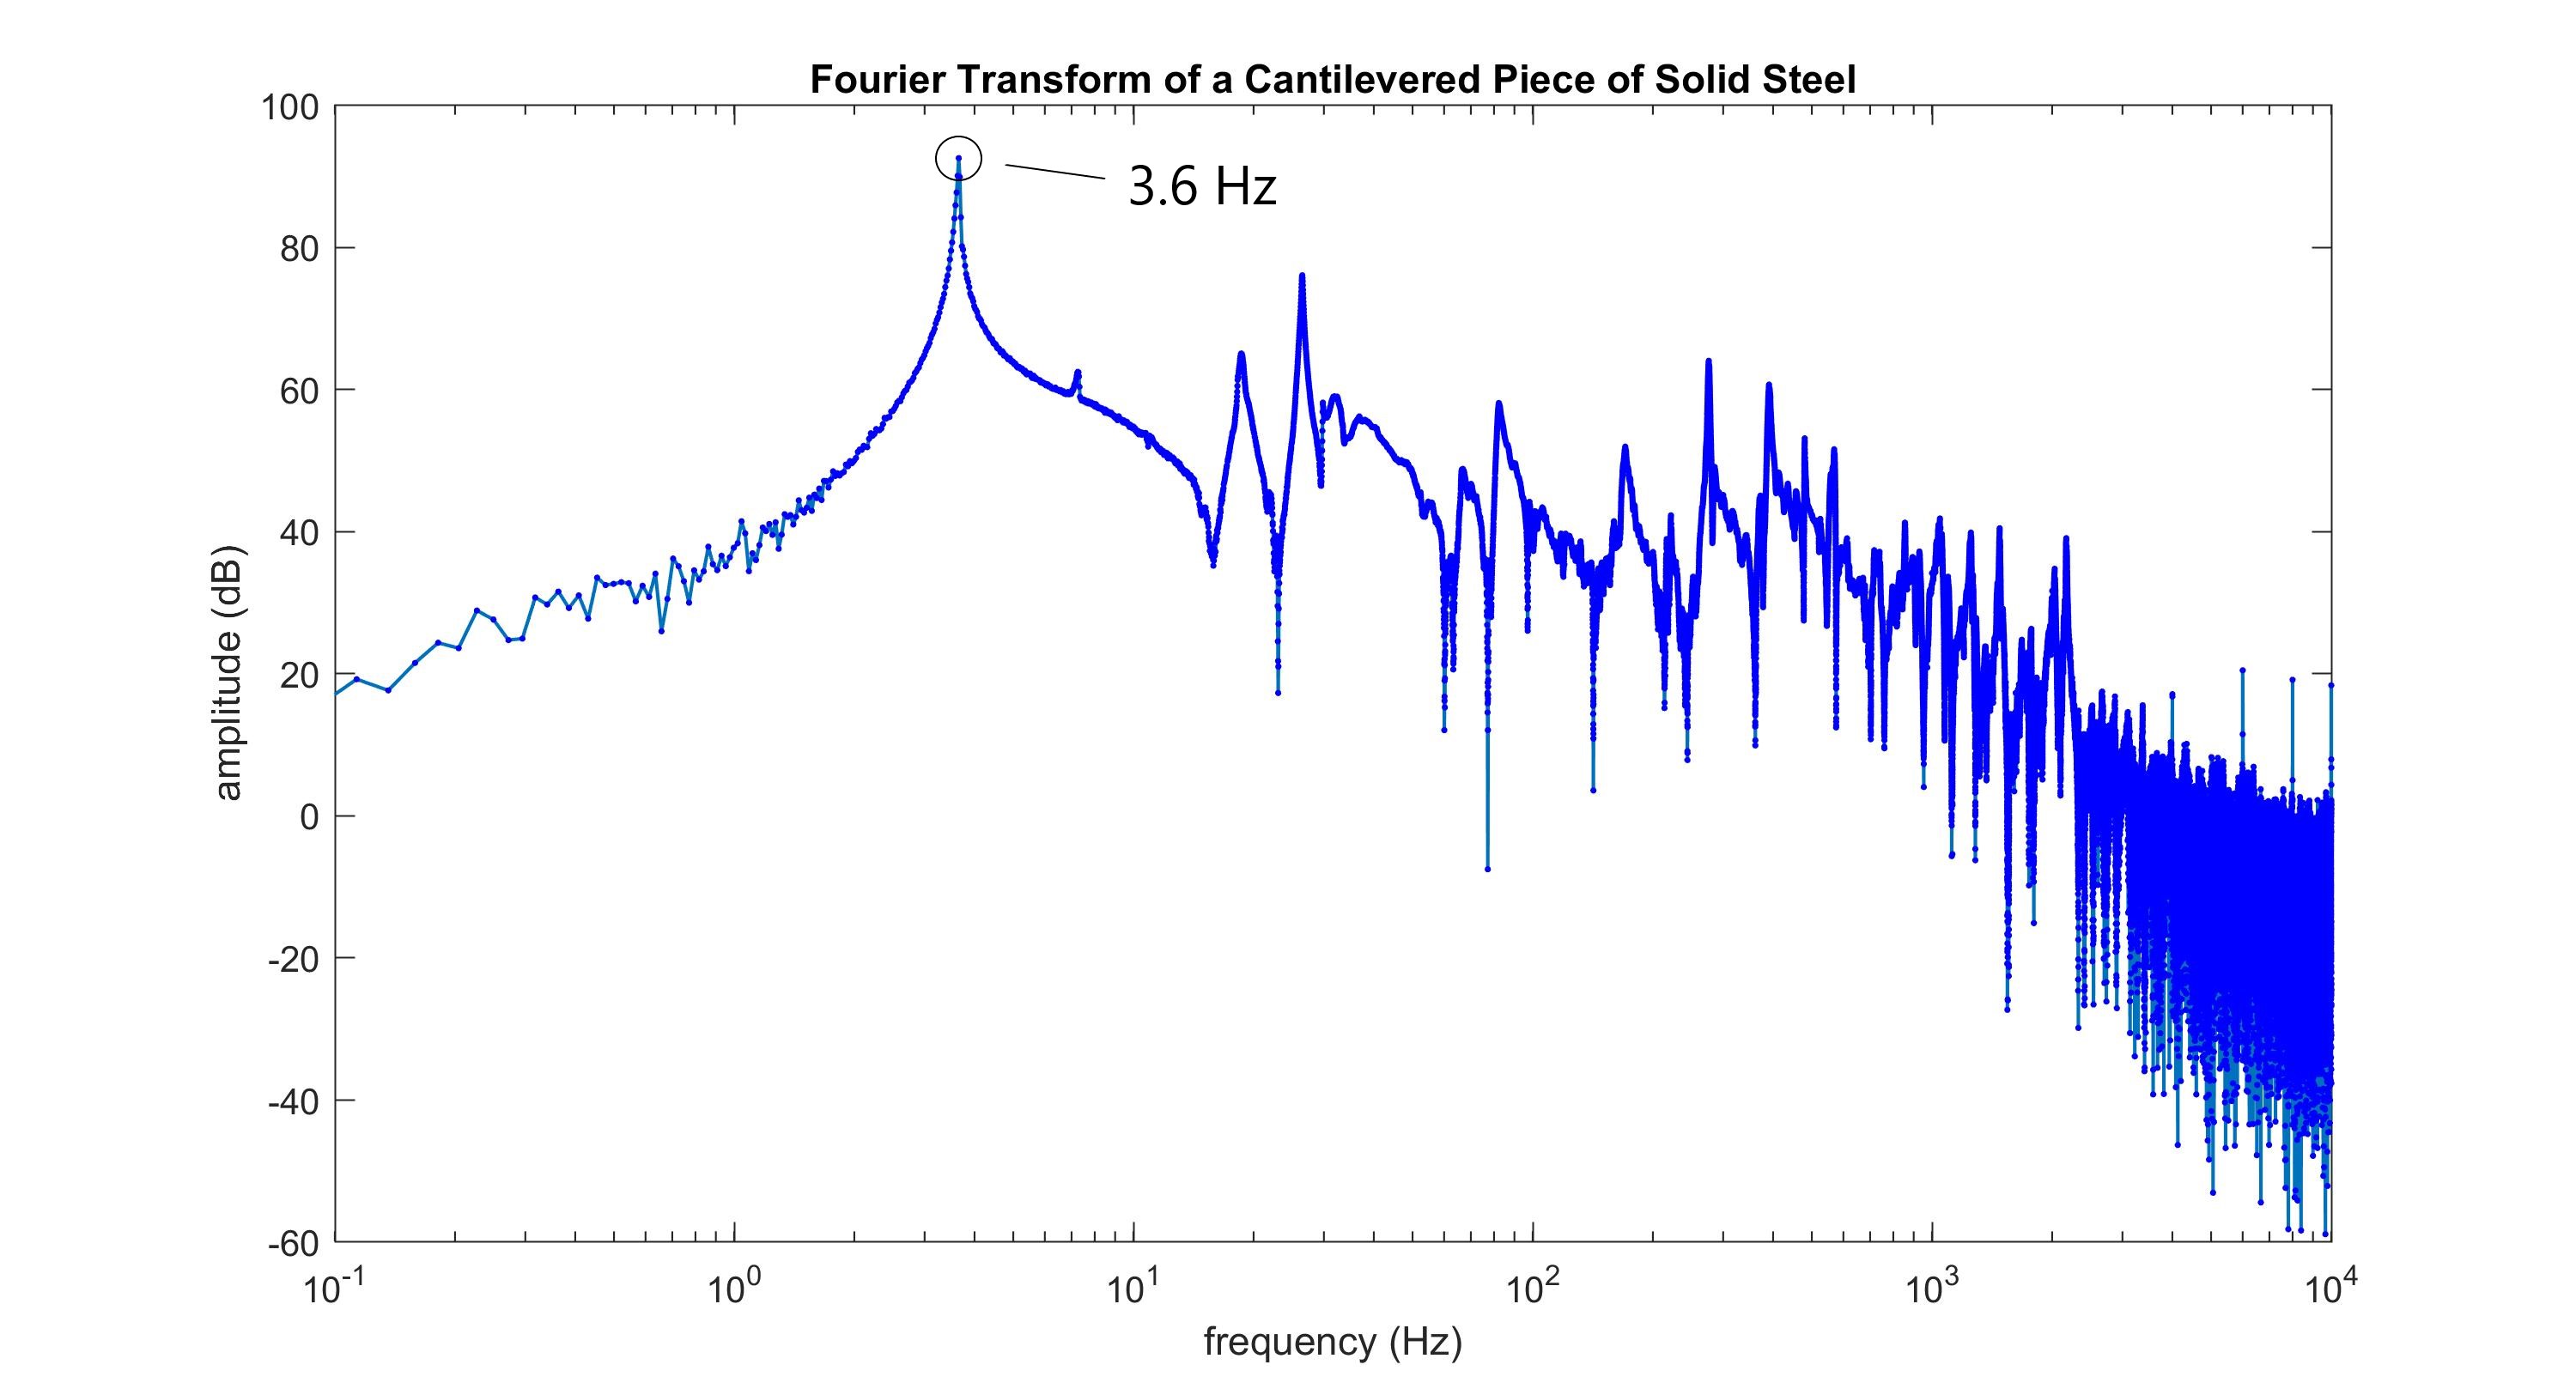
Once broken down by the Fourier Transform (below), it is easy to see that a frequency of around 3.6 Hz is dominant in the signal. Since structures vibrate more in their natural modes, it is now very safe to assume that the natural mode of the structure is around 3.6 Hz.
This is extremely useful, as the Fourier Transform allows us to gain insight with any recorded signal. It's a relatively simple process to perform and can easily highlight the vibrational modes we are looking for in simple structures.