Finding Vibrational Modes through Experimentation
The most straightforward way to identify modes of vibration is through experimentation. Once a structure is excited, recording the vibrations and analyzing these waves can allow us to find the modes of vibration.
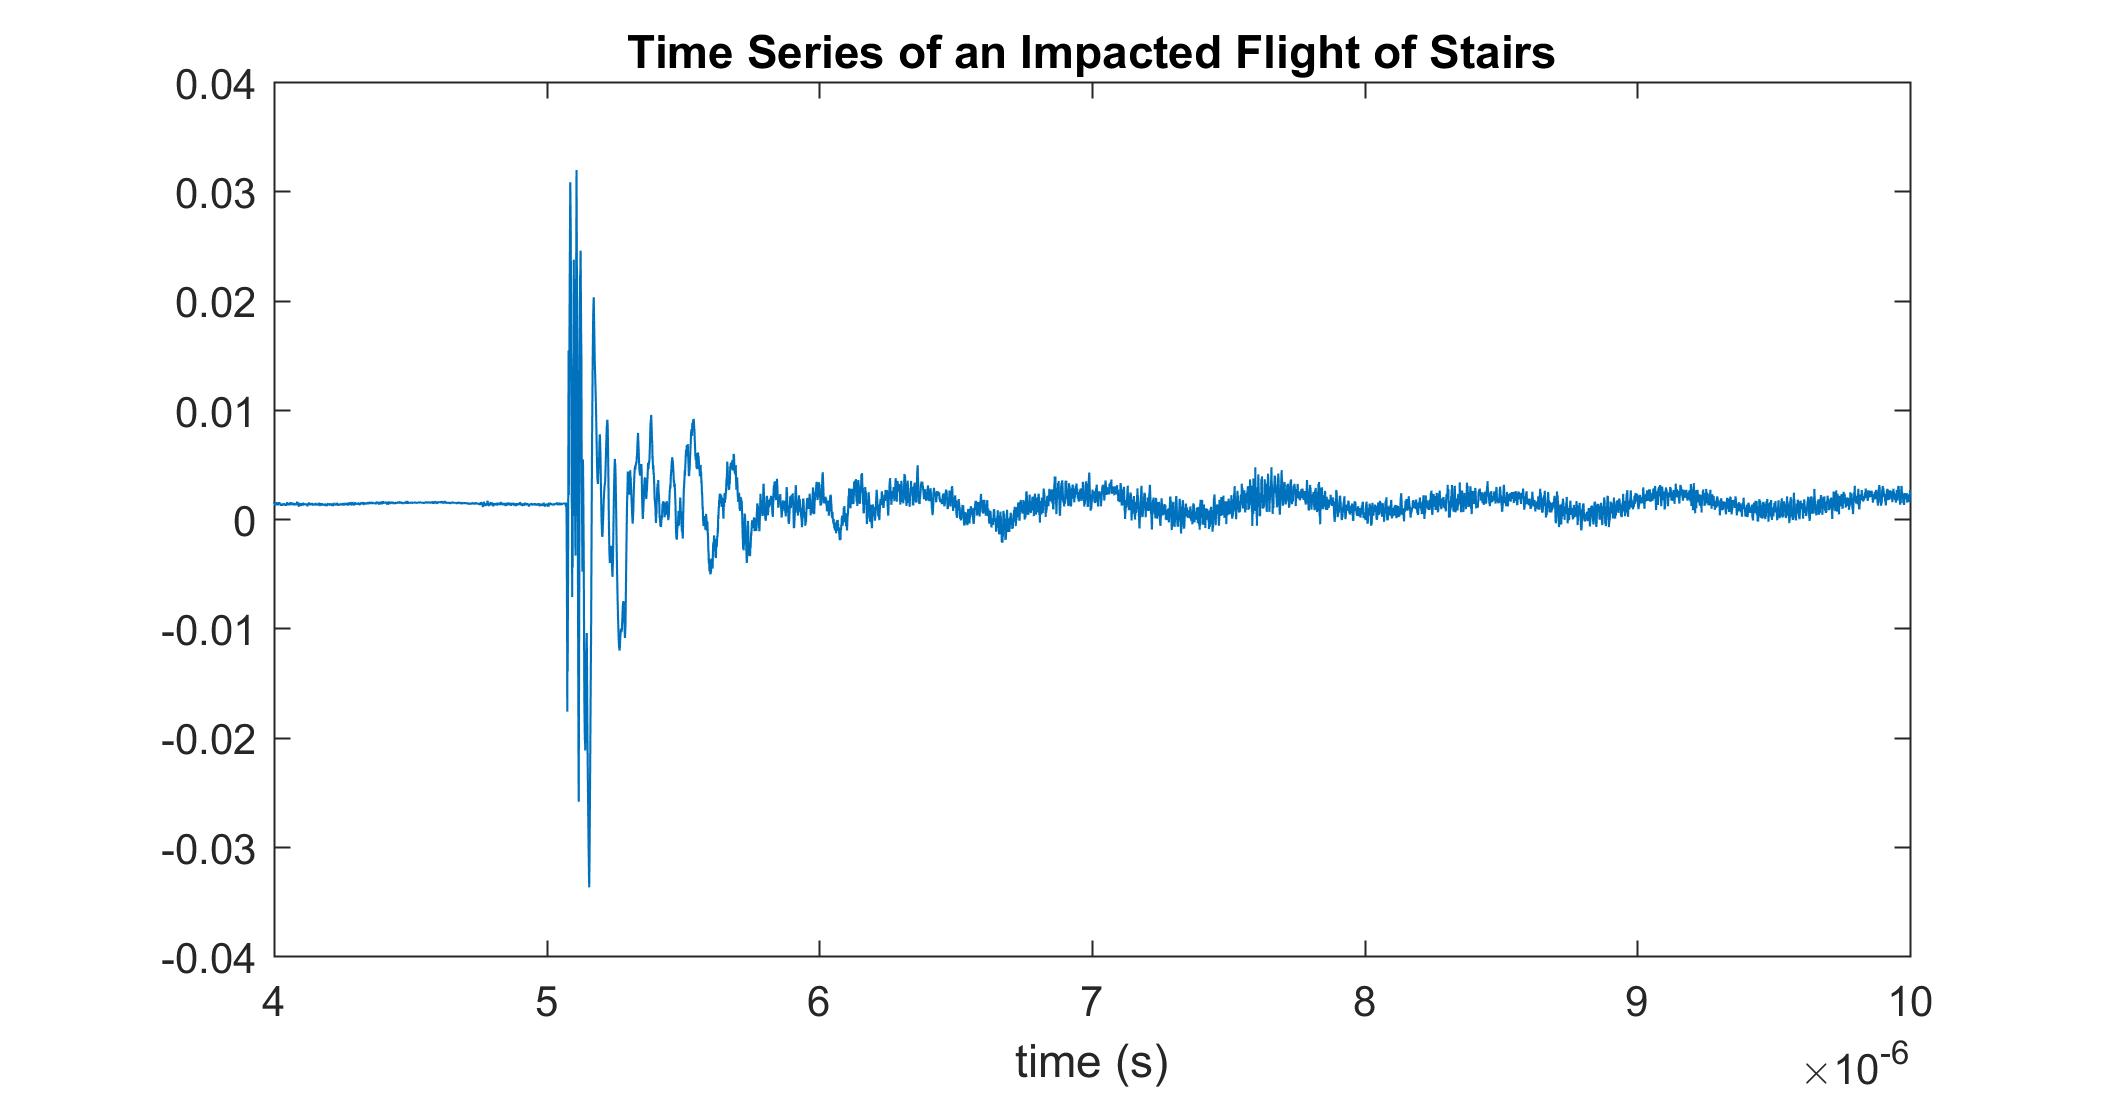
Exciting a structure can be done in a number of ways, the most elementary being simply hitting the structure. This inputs a wide range of frequencies into the stucture, of which the higher frequencies will dampen quickly giving way to the lower frequency oscillations, where the natural mode is usually observed. This method is useful if you do not know what the natural vibrational mode shape looks like. Since a large range of frequencies are inputed, one of those frequencies is bound to be the natural frequency, and thus the modal shape will be excited. In the time series below, you can see how many frequencies are excited suddenly, then slowly die out till just the lowest frequencies remain.

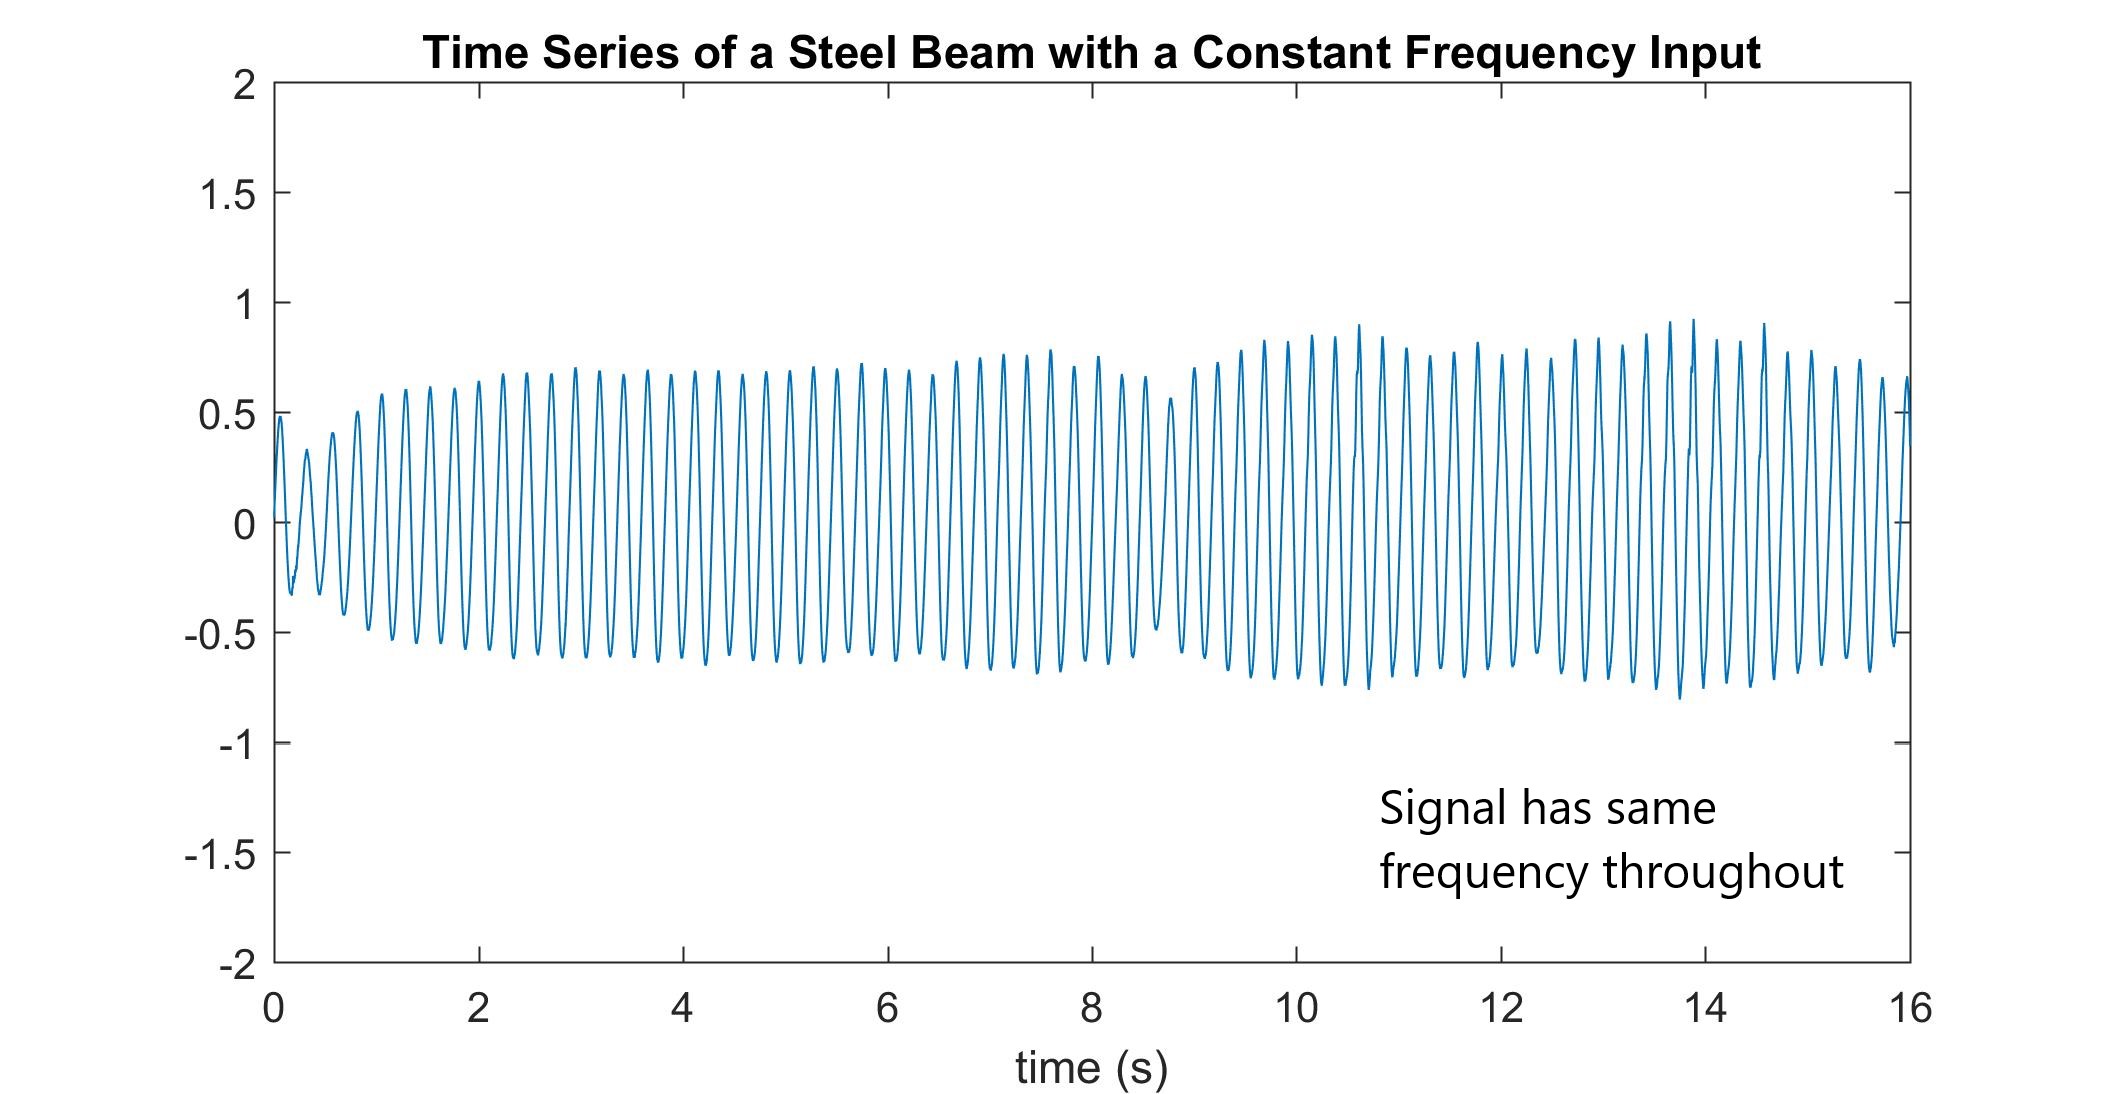
If you already know the natural modal shape, however, it may be easier to input only one frequency into the structure and vary it until the structure matches its modal shape. Inputing only one frequency can be done using a shake table, or if the structure is small and manageable enough, by simply pushing and pulling it. This method gives the advantage that it might not be necessary to do extensive data analysis. If your experiment matches the visualized modal shape, and you know what frequency oscillations you are inputting into the structure, you can say with accuracy that that is the natural frequency.

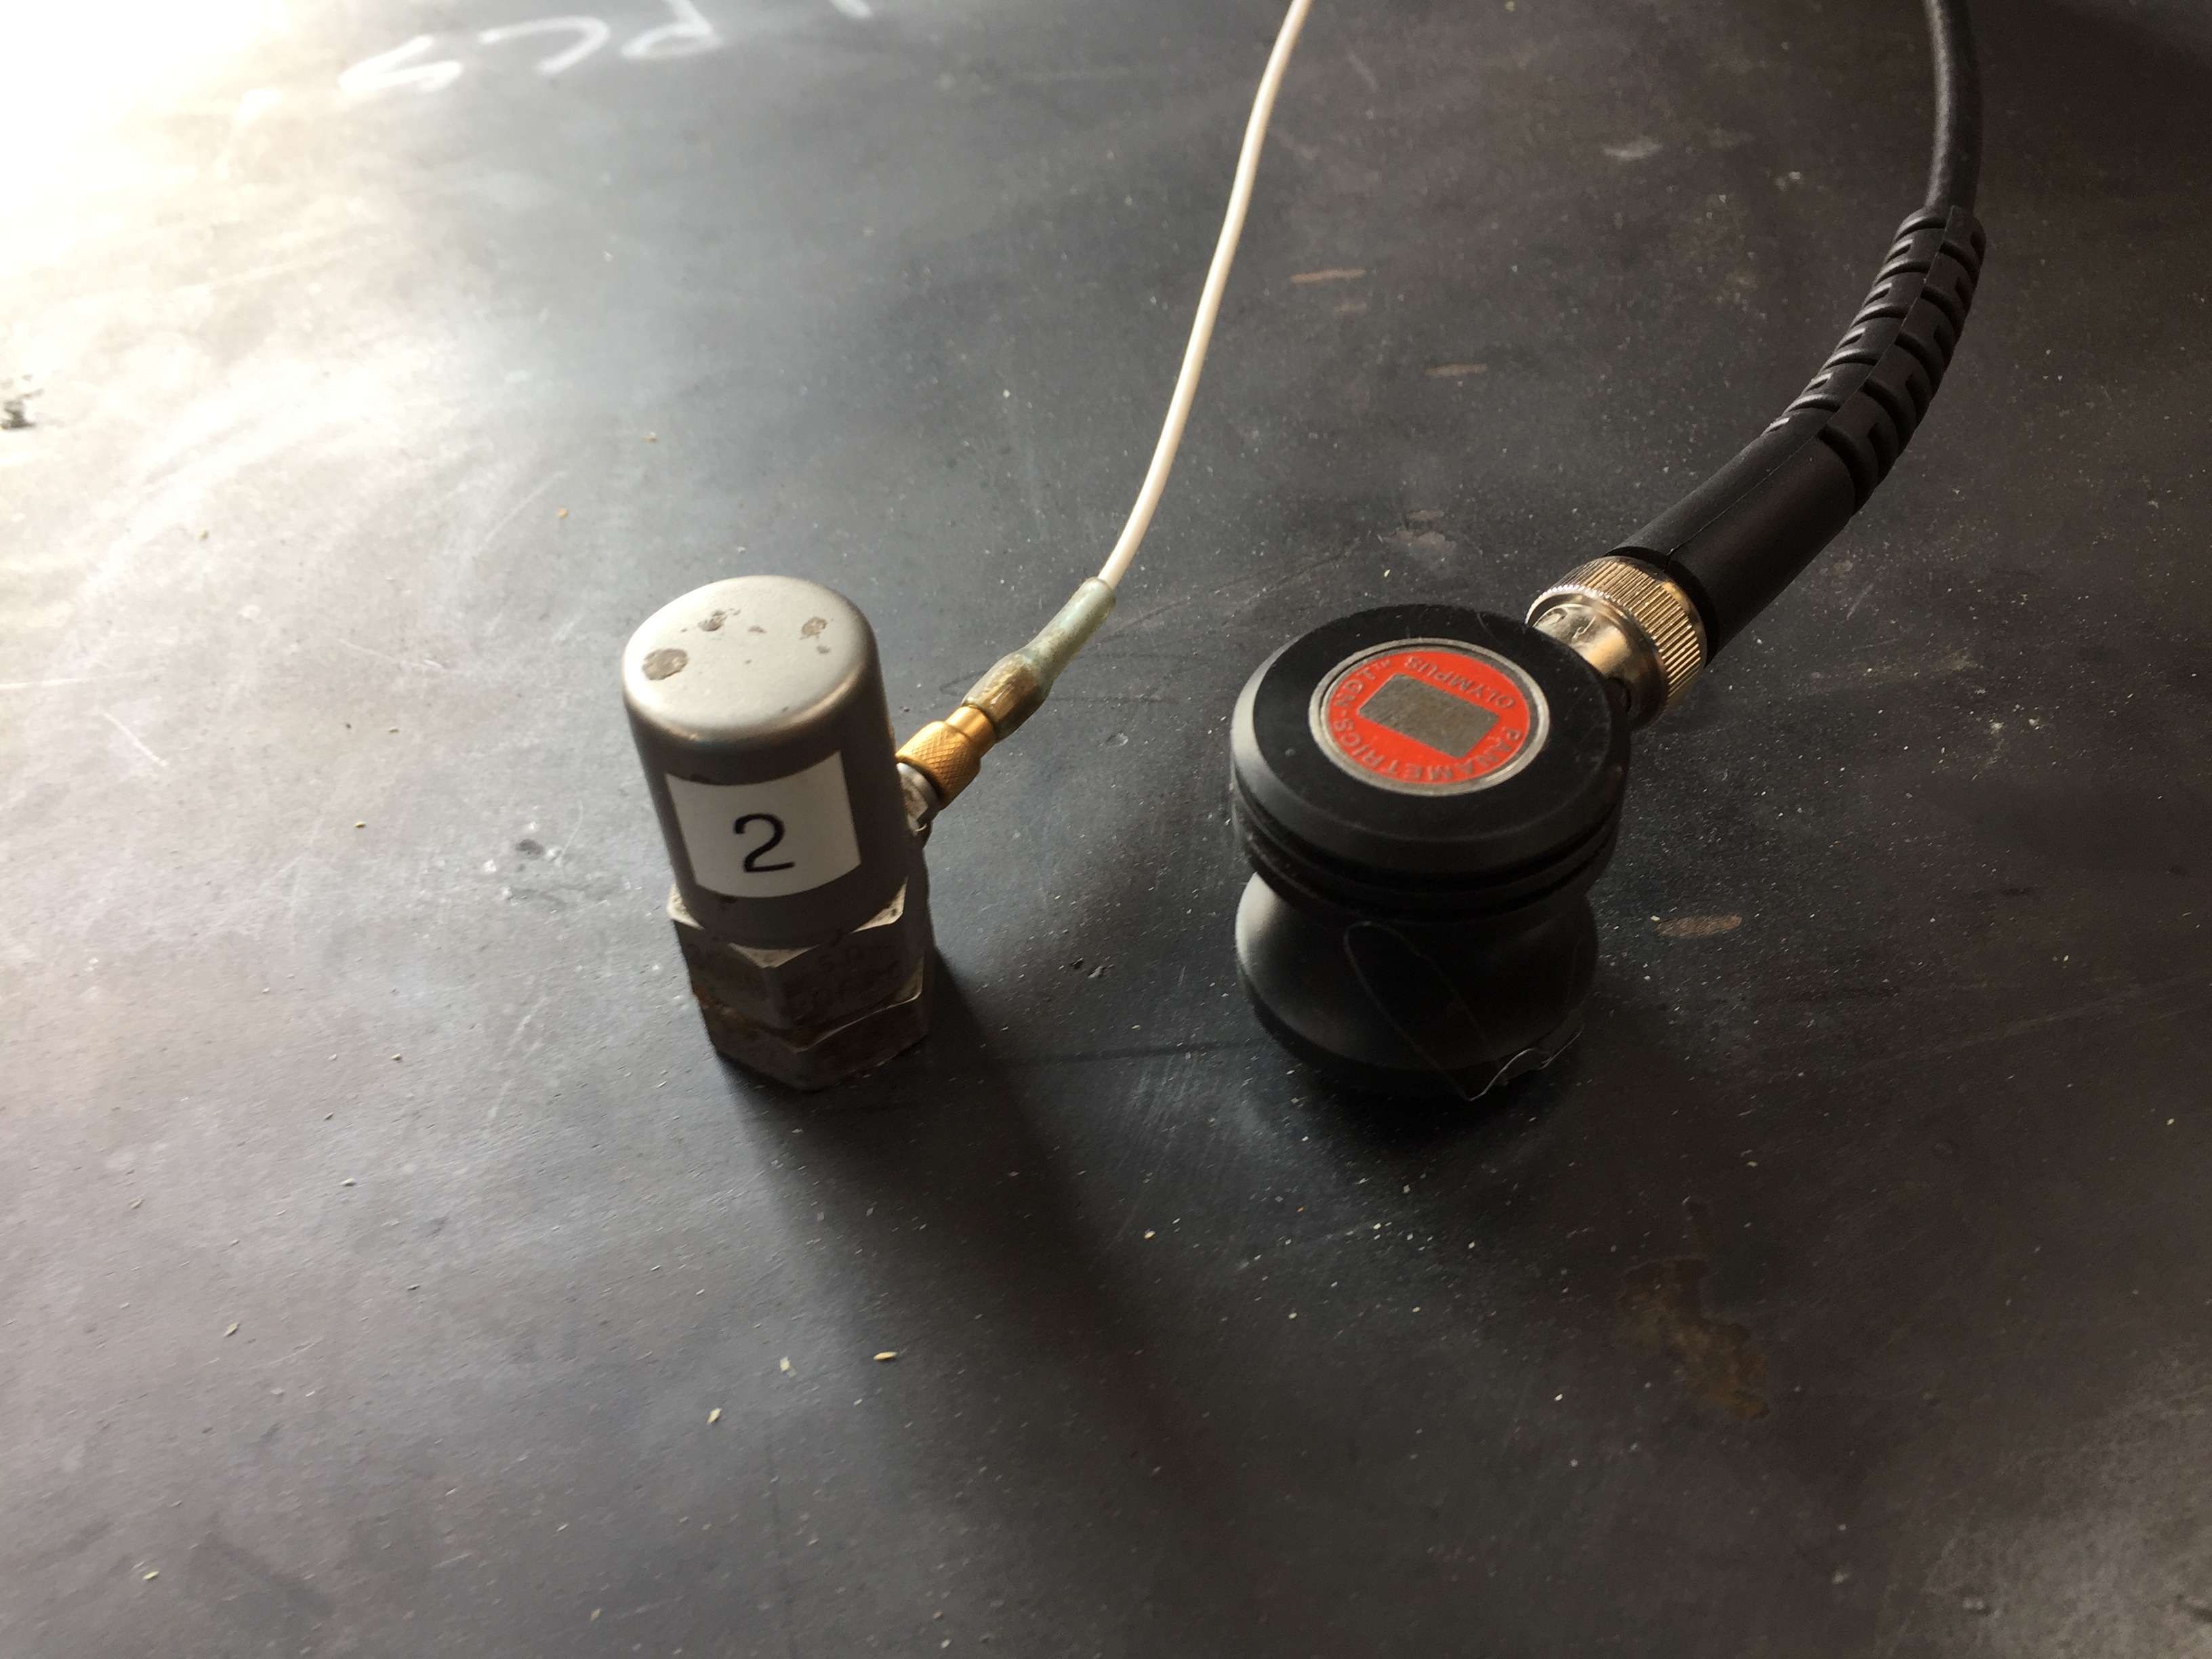
To actually record vibrations in structures I used both piezoelectric sensors and accelerometers. Piezoelectric sensors convert changes in displacement into electrical charges, while accelerometers simply measure the changes in acceleration in a structure. While both sensors achieve more or less the same end goal: providing a data set that can be analyzed to find the modes of vibration, they each have their advantages. Accelerometers are better at picking up low frequency signals while piezoelectric sensors are better at recording high frequency signals. Thus, if I were to experiment on a long, thin cantilever beam, for example, I would choose to record using an accelerometer because I expect the natural mode to be low fequency. Experimenting on a thick, stiff piece of metal, however, I would choose to use a piezoelectric sensor, as I expect the natural frequency to be high.

An example of an accelerometer (left) and a piezoelectric sensor (right).
Once a time series of data is recorded, it can be analyzed using the Fourier transform to display a spectral amplitude vs frequency graph. This graph shows us wich frequencies are more prevalant in the excited structure, and since structures resonate more at their natural modes, it indirectly tells us the resonant modes of the structure (the tallest peak is usually the resonant mode).
To learn more about Fourier Transforms, clink the link below.