Minimizing Random Error
In contrast to systematic error, random error can usually be estimated
and minimized through statistical analysis of repeated measurements.
Many books have been written on statistics and data analysis; for
the labs in this class, however, a short summary should be adequate.
Make repeated measurements, and find
the sample average  and
standard deviation and
standard deviation  (most
scientific calculators will do this for you): (most
scientific calculators will do this for you):

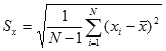
where N is the sample size (i.e., the number of measurements).
Although there is no single accepted standard, one commonly used
way of reporting error, given a sample standard deviation of  ,
is to write ,
is to write  .
Assuming a normal distribution in the measurements and a sample
size of ten or more, this implies that there is a 95% probability
that the true value lies within the upper and lower error limits.
For example, if you measured the height of a random sample of 25
Cornell students and found .
Assuming a normal distribution in the measurements and a sample
size of ten or more, this implies that there is a 95% probability
that the true value lies within the upper and lower error limits.
For example, if you measured the height of a random sample of 25
Cornell students and found  of
5'7" and of
4", you would report a student height of 5'7" of
5'7" and of
4", you would report a student height of 5'7"  8". (In this case, this is the height we would expect if we
measured another Cornell student at random, since there is no single
true height.)
8". (In this case, this is the height we would expect if we
measured another Cornell student at random, since there is no single
true height.)
We can go on to estimate how close ,
our sample mean, is to the true or population mean. The population
mean is what we would get by taking and averaging a huge number
of measurements; for example, averaging the heights of all the students
at Cornell. We would expect our average of a sample of 25 student
heights to be closer to the true average, in general, than any single
height measurement would be. However, there is still uncertainty
in ,
and we can estimate this by calculating  ,
the standard deviation of the mean: ,
the standard deviation of the mean:

For the average student height, 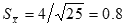 inches,
and you could report the average Cornell student height as 5'7"
2",
or 5'7" 1.6",
with 95 percent confidence. In other words, if we repeated our 25-student
sampling procedure 20 times, we would expect our error limits to
include the true mean 19 times out of the 20 samples, and miss it
completely in one case out of 20. inches,
and you could report the average Cornell student height as 5'7"
2",
or 5'7" 1.6",
with 95 percent confidence. In other words, if we repeated our 25-student
sampling procedure 20 times, we would expect our error limits to
include the true mean 19 times out of the 20 samples, and miss it
completely in one case out of 20.
Two pitfalls should be kept in mind when using the standard deviation
of the mean: First, although you can make arbitrarily
small with enough repetitions of a measurement, remember that it
is the precision you are improving. The overall accuracy will be
good only if the systematic error present is similarly small. Second,
note that refers
to the error in measuring the average; whether this is useful depends
on the situation. If you are interested in finding out how tall
Cornell students are, compared to Stanford students, it makes sense
to compare the averages and use .
If you are designing a staircase with a low{hanging beam, however,
and want to ensure that most students will not bump their heads,
you need to use and
,
which properly characterize the uncertainty in the height of the
Cornell students, rather than the uncertainty in the average.
|