Introduction
Strength and stiffness are easily confused concepts in engineering.
Interchangeable usage of the terms in common speech cloud
their important distinctions in material classification.
The words 'stiffness' and 'strength' both imply a sense of resistance
and are both determined by geometry and material properties. However,
a strong object may not necessarily be stiff, and vice versa!
As an engineering student, it is important to remember:
Strength ≠ Stiffness
- Strength [N/m2] is the maximum stress that the
material can resist before deformation or fracture.
- Stiffness [N/m] is the rigidity or resistance to bending.
Stress-Strain Diagram
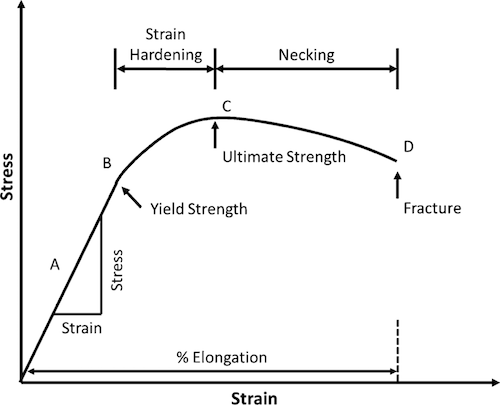
To fully understand these concepts, let's introduce
the stress-strain diagram. This curve is constructed by
plotting data from an uniaxial tension test, where a
sample of the material is slowly stretched in one direction until fracture (from matsci notes).
Two key points from the figure shown above:
- Elastic region is the linear part, and the slope in this
region is the elastic modulus, which is an important part of stiffness, as discussed later.
- Two strengths are shown - yield strength and ultimate strength,
both of which correspond to particular stresses
Important Differences
Stiffness
- Types of stiffness - axial, torsional
- Axial stiffness can be calculated by k = AE/L, where A is cross-sectional area,
E is elastic modulus, and L is length
- Torsional stiffness can be calculated by k = GJ/L, where J is torsion
constant, G is rigidity constant, and L is length
- More generally, stiffness is calculated by F/Δ.
- To ↑ k, ↑ A and E (for torsional, G and J) or ↓ L.
If geometry is held constant, simply increasing the elastic modulus
with a different material selection will increase stiffness.
- Stiff materials are used in cases where the structure is not supposed
to displace/bend. If a structure is intended to bend
(e.g. a diving board), then a more compliant material should be used.
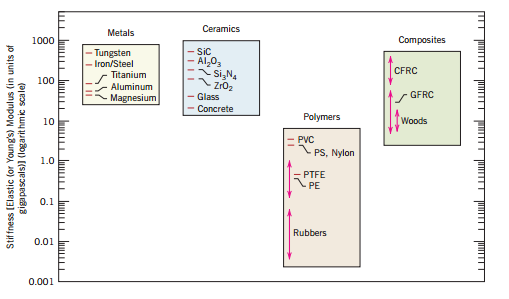
- Figure below shows stiffnesses of different materials, from
which you can notice the difference compared to the figure on the
right:
Strength
- Types of strength - yield strength, ultimate strength
- Yield strength (σy): stress at which material begins to
plastically deform. This can be seen on a stress-strain curve as the
point where the graph is no longer linear. Since it is quite difficult to
determine an exact point where a line stops being linear, σy is usually
defined as the point where the value on the stress-strain curve is 0.2%
off from what it would be if it was completely linear (from matsci notes).
- Ultimate tensile strength (UTS) is the maximum stress on a stress-strain curve.
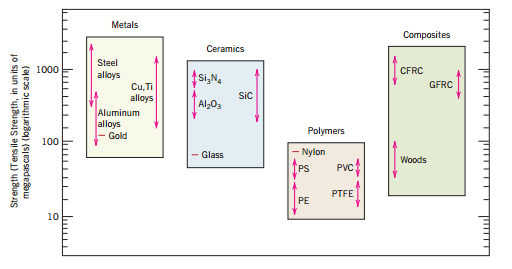
- Figure below shows the strengths of various materials, from
which you can notice the difference compared to the figure on the
left:
Example
Below are images of materials order from highest to lowest stiffness (assuming same geometry)
with corresponding approximate ultimate tensile strength:
Rubber Strength(UTS): 25 MPa

Wood Strength(UTS): 120 MPa

Glass Strength(UTS): 20 MPa

Cermaic Strength(UTS): 1000 MPa
Seems kind of counterintutive!