Py Display
ECE 5725 Final Project
David Kim, Huajun Gu
Introduction
PyDisplay is a python library that is designed to easily organize data and graphs and display it on the PiTFT. The goal is to create a pygame display library that would allow users with a bit of programming experience to create their custom display pages easily. This means that they have more power over displaying what they want and they can focus more of their time on the actual applications of the embedded device rather than trying to have stuff display correctly.
Design and Testing
Design
This project was designed in a modular way so it would be easier for the user to work with the project. Although the code itself might look very daunting with many layers of classes and some complicated Python syntax, the user doesn't have to worry because he/she only has to worry about a few of the main modules listed below:
PyDisplay
This is the key class that handles initializing the whole display, keeping it alive, and shutting it down. Users need to initialize an instance of PyDisplay, setup the custom pages that the user wants by calling one function, and start up PyDisplay by calling the run function. PyDisplay is designed to be easy to use.
Pages
This is key class that allows users to customize PyDisplay to their needs. Pages are what gets displayed; with the PageManager class, users have the capability of switching between multiple pages that might serve different needs. The user can create their own child class extending off of Page. This process is very simple too. Users just need to create objects in the class constructor, define some custom functionalities, maybe add a few callback functions as needed, add all the Drawables on the page to the self._drawable variable. Then drawing and page switching taken care of for you.
Events
The user doesn’t have to worry too much about events except that they will be emitted. If the user wants to have a certain functionality occur if a certain event occurs, they just have to register a callback function to be called when a certain event occurs with the event_handler that is accessible in every Page. Behind the scenes, Controllers are used to detect things and then emit the appropriate events. Then the EventHandler catches these events and then run the correct callback functions. All of the possible events are listed in Events.EventTypes. More information about each type of event exist in each event’s custom classes.
Controllers
Controllers are used to detect and then emit events. There are two controllers included, one for detecting screen related events and one for GPIO inputs. The former will handle presses and movements on the screen. The latter can handle when buttons are pressed, released, and held. For more information on what events get emitted when, please look at the function descriptions in the Events and Controllers classes.
Drawables
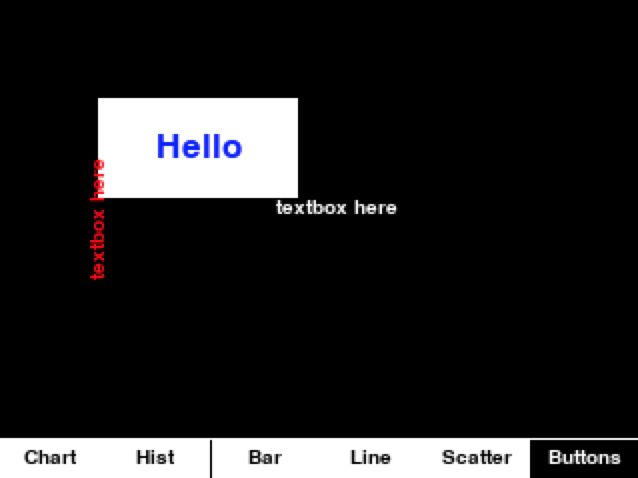
The Drawables class is the parent of any object that would be able to be displayed, like buttons, graphs, text boxes and etc. The Drawables class keeps track of an object's location and dimensions and it also takes care of moving objects on the screen. There are a few classes that extend Drawables like Button and Text which can be used by the user directly or as samples for more complicated Drawable objects that the user might want. For the Button, the user has the ability to input the location, dimensions, text on the button, font size, color, etc. Lastly with buttons, something normally needs to occur after the button is pressed; the Button class allows users to define their own custom callback function that gets called when the button is pressed. Drawables also contains the Text class that the user can use to display text on the screen. The user has the freedom to manipulate the location, text, font size, and font color similar to the button class. In addition, the user has the ability to manipulate the alignment of the text and can choose to rotate the text.
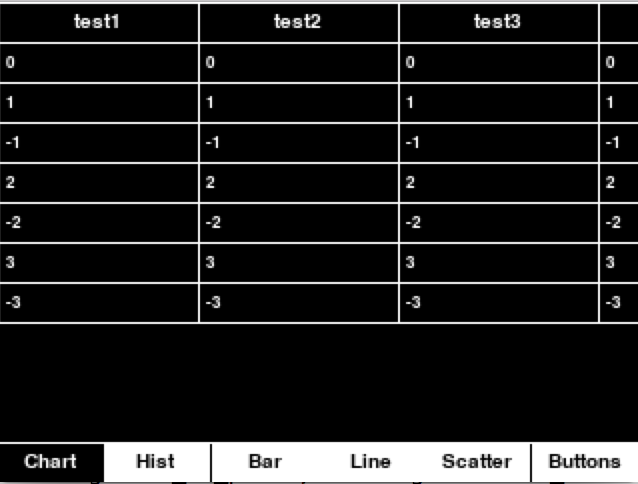
Chart
The chart class is another class that is at the user’s disposal for data organization. The chart class organizes the desired data in a table format. The user has the ability to decide the location and the dimensions of the chart. Additionally the user can change the background color and the font color of the chart. The chart class also has the capability to sort the data in the users desired format. The chart’s sort has the options of FIFO (newest data at the bottom), LIFO (newest data at the top), ascending, descending, or other (user provide own compare function). Another useful feature is that users can have the Chart monitor a fifo in which another background process could write new data; the chart can update itself with this new data accordingly.
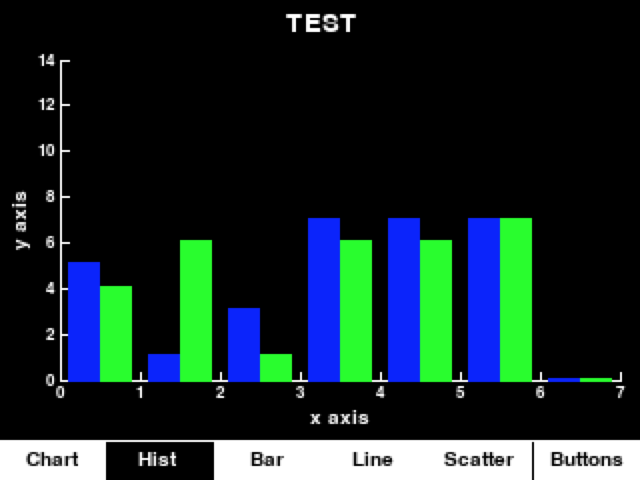
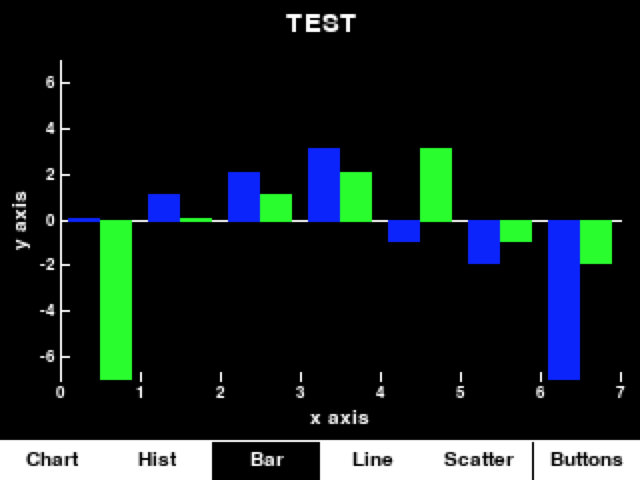
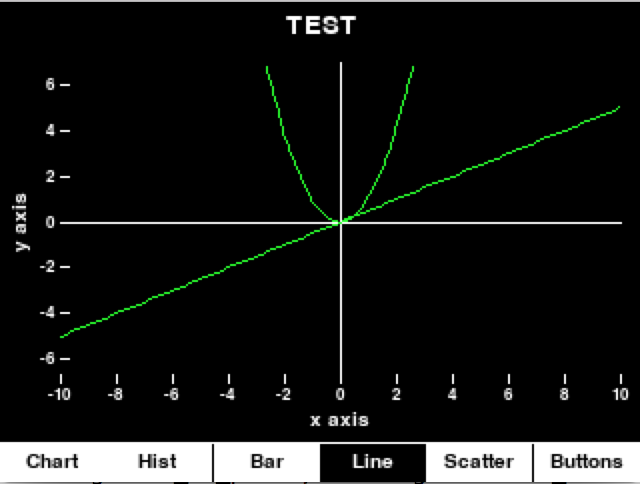
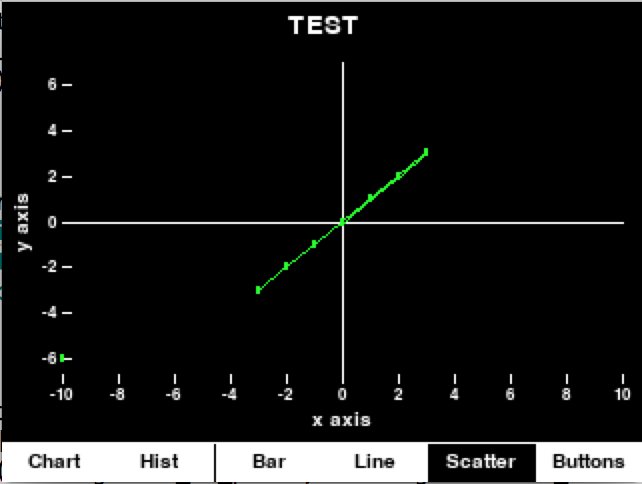
Graphs
The graphs class extends drawables because everything that needs to be displayed must be an extension of the drawables class. The graphs class is also a skeleton class for all the different kinds of graphs that are available for the user to use. The different types of graphs available are scatter plot, line graph, bar graph, and histogram. The user has the freedom to decide the location and dimensions of the graph. The user can also set the min and max values for the x and y axes and also decide the intervals between each of the tick marks. The user can label the x and y axes and set a title for the graph. Similar to the chart, the user can also define a fifo to update data. For the user creating a graph is relatively simple, because it only requires a couple of lines of code.
Testing
Most of the testing was done by hand. Settings were manually modified and then functionalities were tested through displaying the testing page and interacting with it. This of course is not the best way to go about testing because it's hard to reproduce and does not promote continuous testing. The ideal way to go about testing is through unit tests where each individual function is tested. Since most of the functions don't actually return anything, most of the testing would have to involve calling functions and then observing changes in the class variables. Due to the large scope of the project, unfortunately there were not enough time to write unit tests for everything.
Results
We were able to successfully meet all our intended goals for the Py Display project. One of our biggest goals was to simplify data organization for a user. Our project allows for any user with a very basic programming experience to use the full project at ease. One of the biggest limitations of our project was the PiTFT itself. The size of the screen of the PiTFT is very small so there are not a lot of pixels to work with. This limits the accuracy that we can show with our graphs. The PiTFT’s built in touchscreen was also a small limitation; overall the touch screen responded very well, but there were moments when the touch screen would not register the touch inputs. Additionally, there was a lack of unit tests that were written. It would not have been too difficult to write unit tests but due to a lack of time, they were not written. A lot of the details are reflected in the function descriptions within the library. How to install and how to use instructions are provided in the README.md.
Conclusion
The PyDisplay project is a Python library that is designed to organize and display data with ease, typically on a Raspberry Pi PiTFT display. The PyDisplay library has the ability to take the data and display it on a screen in a table form or as one of the many graphs that the library offers. This project was not designed with the intention of it being a stand alone project but with the vision that it can be used to support many users who collect data on a Raspberry Pi system. One particular target group that we had in mind is the Cornell TABER group.
Future Work
- More documentation - Most of the documentation currently exist as function specifications and as a demo. It would be nice to have the documentation migrated into the README.md. It is a relatively easy, but tedious process.
- Unit tests - Unit tests would make everything so much better. Unit tests would make development easier and errors easier to find.
- Additional functionalities - An interesting idea that came up was the idea of being able to scroll in a graph. However this idea was not implemented because the calculations involved in order to change all the axes is too complicated.
Materials
The only materials that used were the ones provided: RaspberryPi and PiTFT.
Contributions
Huajun Gu
- Wrote up the logic for Controllers, Events, and Event Handlers.
- Wrote the skeleton for Graphs, Charts, and Pages.
- Buit upon graphs skeleton: added more graphs
- Added demo pages
- Worked on report website
Code Appendix
All code can be found at github.com/Guent4/pydisplay.