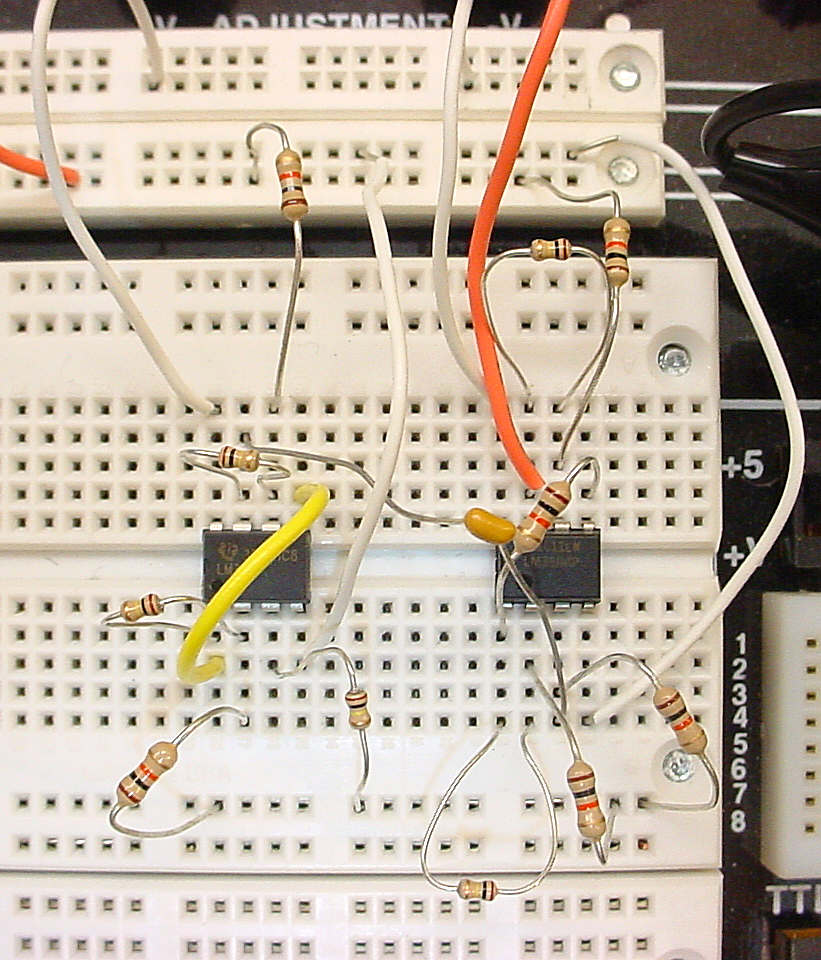
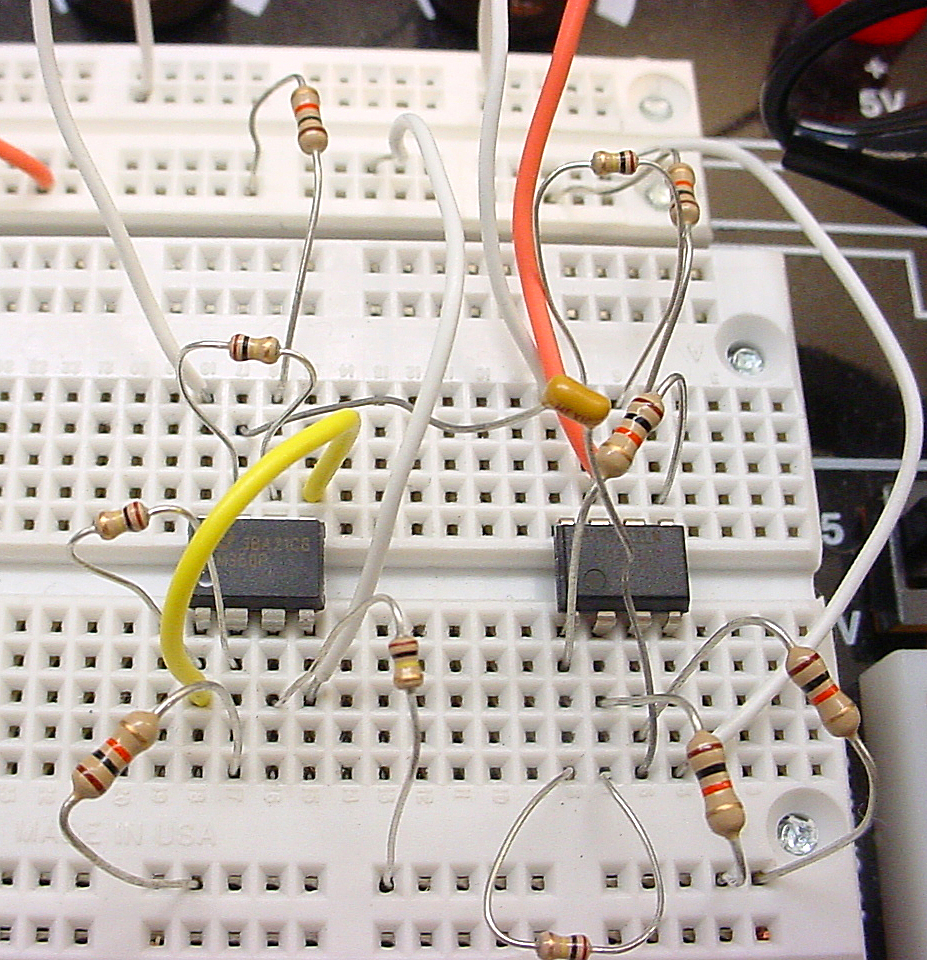
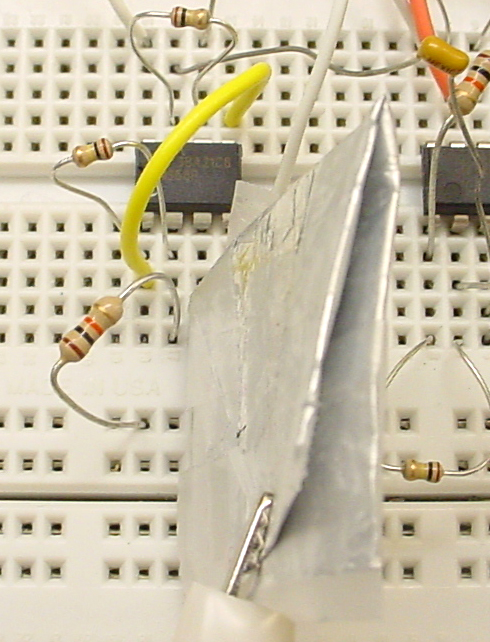
The images below show the circuit built on the protoboard. The third image shows the (tape insulated) aluminum foil shield clipped over the noise source resistor.
Assignment
- By inspecting the spectrogram of the loon call (and by listening), identify the call and the noise component. Filter the loon call to remove the wind noise. Use a Butterworth filter and experiment with the filter order and cutoff frequency to obtain the clearest sounding loon call. What changes in the spectrogram can you see? You will want to experiment with the second parameter in the spectrogram function to obtain the clearest spectrogram. Try values from 128 to 10000 and describe what happens to the spectrogram.
- Use the gPRIME analysis window to produce amplitude histograms of the clean and noisy channels. Clearly, the added noise should broaden the amplitude ditribution. But to get more quantitative:
- Set
lineNoiseAmp=0andthermalNoiseAmp=0.1.Since the noise is Gaussian, the amplitude distrbutions shoud be Gaussian. Are they? What is the standard deviation of the width of the two amplitude distributions? Using a t-test, how likely are they to be from the same distribution? How do the estimates compare with the actual amplitudes from thelab7makeAPcode? - Set
lineNoiseAmp=0andthermalNoiseAmp=0.2.Discrimination is likely to be harder than before. Use the analysis window filter options to lowpass filter the noisy action potentials to see if you can get better discrimination. - Set
lineNoiseAmp=0.1andthermalNoiseAmp=0.0.What shape are the distributions? Why? What does the 60 Hz notch filter do? - Set
lineNoiseAmp=0.05andthermalNoiseAmp=0.05.Estimate the mean amplitude of each action potential disribution and its error range using an amplitude histogram. Use the analysis window real time correlation feature to get an average amplitude and duration of the larger and smaller action potentials. Do this by setting the correlation source to be the same as the analysis channel, and centering the window. As more APs are recorded, you should see the uncorrelated noise get smaller compared to the trigger event. TheSave Signalbutton will allow you to save the waveform as a textfile to plot later, and in more detail for you lab report. How do the estimates compare with the actual amplitudes and durations from thelab7makeAPcode?
- Set
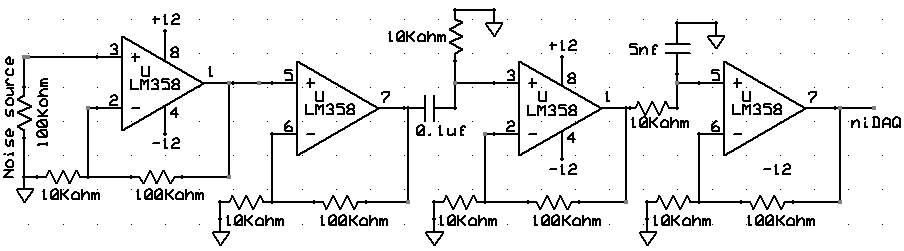
- Connect the circuit shown above to an input channel of the NIDAQ interface like you did in lab 5.
- Compute the cutoff frequencies of the highpass and lowpass filters in the circuit.
- Modify simpleAI.m to acquire about 1 second of data at 10000 Hz sampling rate, then plot the voltage versus time. Compute the root-mean-square (rms) amplitude of the voltage and display it on the plot. The Matlab command
sqrt(mean(data .^2))
will compute the rms amplitude.
Plot the power spectrum of the 1 second of data separately. The Matlab command
pwelch(data,[],[],[],Fs);
will estimate and plot the spectrum for the vectordatasampledFsper second. Do you see evidence of 60 Hz interference in the spectrum? Draw arrows indicating 60 Hz interference on the spectrogram and include with your report. - Use a small piece of aluminum foil to shield the noise source resistor by surrounding the resistor and its leads and grounding the aluminum foil. What happens to the rms noise amplitude? How much does the 60 Hz interference decrease (as judged from the power spectrum)?
- Every resistor (metal or biological) makes noise because of thermodynamic fluctuations.
At room temperature (20°C), the rms voltage is given by
v(rms)=1.3x10⁻¹⁰(RB)1/2
where v is in volts, R in ohms and B in Hz of bandwidth. This noise is refered to as Johnson noise. The bandwidth of you circuit can be estimated from the cutoff frequency of the lowpass filter. This level is a lower limit to the noise you will observe. How does it compare with your rms values for the shielded noise source resistor? Other sources of noise are:- 60 Hz interference (as you have seen).
1/fcurrent fluctuations in the noise source resistor. This averages 0.3 to 3.0 rms microvolts per decade of frequency bandwidth.- Current fluctuations in the amplifier input transistors. For the LM358 opamp, the rms noise level is about
v(rms)=60x10-9(B)1/2
where v is in volts and B in Hz of bandwidth.
- Replace the noise source resistor with a wire. How much does the rms noise amplitude decrease? This noise level should approximate the amplifier noise.
- Decrease the bandwidth of the amplifier by replacing the 5nf capacitor with a 10nf capacitor. How much does the rms amplitude of the noise decrease? Does it behave like Johnson noise? Why?
Your written lab report should include:
- Answers to all questions above.
- Appropriate images to support your answers.
June 2007 Copyright Cornell university