BioNB 442: Lab 5
Passive cell model and intracellular amplifier
Introduction.
You will build a simple, passive model of a neuron then use use Matlab programs to probe the electrical characteristics of the model. You will use the supplied function generator program, but build your own custom display and analysis program. You will also build the model cell and an intracellular amplifier.
Procedure:
- Set up the daqfcngen for around 20 Hz, 0.5 volt square waves. Connect the output to the simulated current electrode and to an input channel. You may neet to modify the gain on the windows audio control panel to make the actual output 0.5 volt.
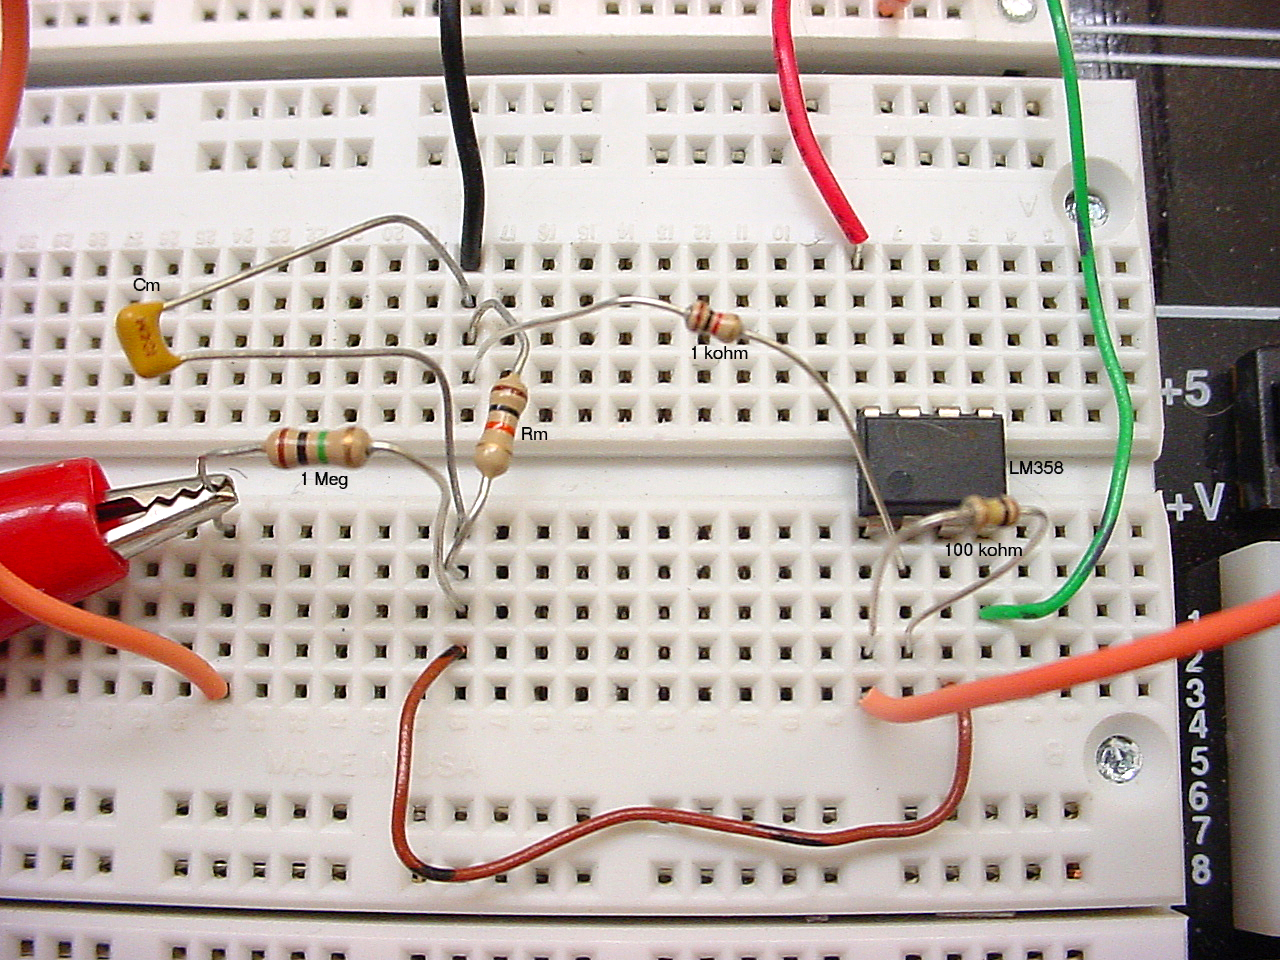
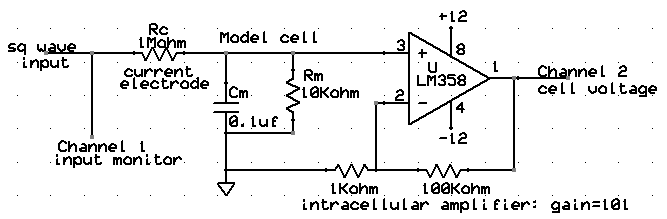
- You will need to build and connect a circuit for this lab. The schematic is below. The amplifier will increase the size of the input by 101 times for the components shown. The LM358 datasheet is here.
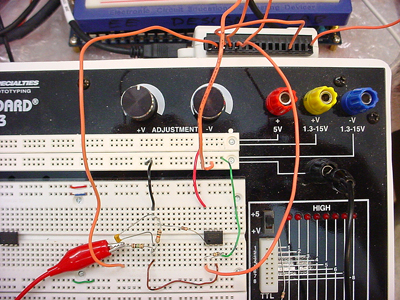
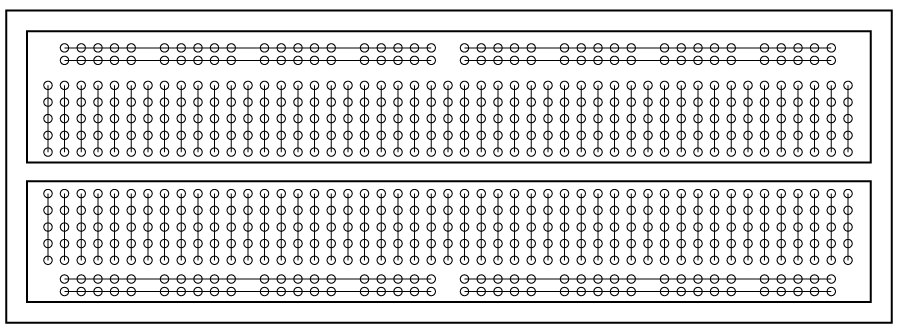
A picture of this circuit on the prototype board is below. Cllick the image for a magnified version. There are three wires near the top of the board. With these settings, the red wire is +12 volts, the green wire is -12 volts and the black wire is connected to ground on the board. The second image shows a zoomed-out version with the connections to the National Instruments USB-6008 interface. Notice that the voltage adjustment knobs at the top-center are set to about 50% of their range. The white protoboard with all the holes acts as the substrate for quickly building circuits without soldering. The holes are connected with wires internally as shown here.

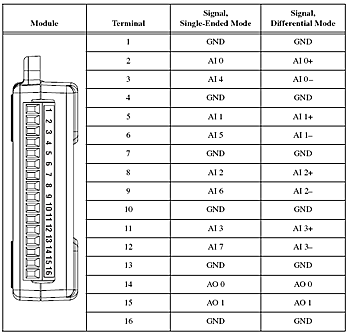
- The national Instruments USB-6008 connections are shown below and the full datasheet is here. You will need to connect to terminals 1 (gnd), 2 (analog input 0) and 5 (analog input 1).
The code necessary to turn on the USB-6008 is below and would replace the similar code for the winsound device you have been using.
%define the input
adaptor = 'nidaq';
adaptorData = daqhwinfo(adaptor);
id = adaptorData.InstalledBoardIds{1} ;
Fs = 5000;
% Analog input object Configuration.
% Create an analog input object with two channels.
ai = analoginput(adaptor, id);
ch = addchannel(ai, [0 1]);
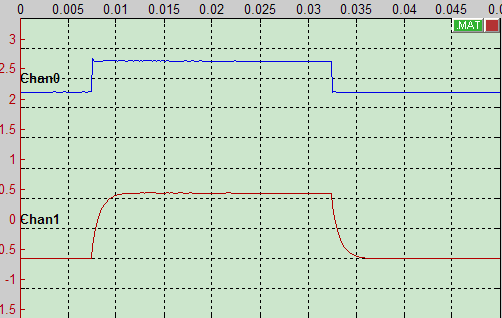
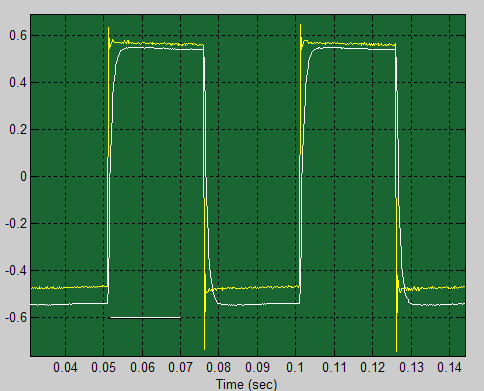
- There are two images below. The first should be familar from lab 1 and is generated by gPRIME. The waveform you expect from the model cell is on channel 1. The input current square wave is on channel 0. The second image is from a custom program based on simpleAI.m where the yellow trace is input and the white trace is output. The horizontal white line shows the region used for analysis in the next steps.
The shape of the model cell output voltage is
v= (Vin/Rc)*Rm*(1-exp(-t*a))
where Vin is the output from the function generator, Rc is the resistance of the simulated current electrode, Rm is the membrane resistance, and a=1/(membrane time constant), and time, t, is measured from the rising edge of the stimulus. A program to compute this function is below for arbitrary values of the time constants and Rm.
figure(10);clf;
%Waveform of cell mambrane
a = 1/0.001 ; %1/(membrane time constant)
Fs = 5000; %sample rate
ampIn = 0.5/1e6 ; %amps=volts/resistance
Rm = 1e4; %the membrane resistance
t = 0:1/Fs:.02;
%simple exponential
v= ampIn*Rm*(1-exp(-t*a));
plot(t,v)
- The
computation for obtaining the input resistance and time constant of the model cell will be:
- Determine the rising edge of the voltage input waveform and obtain its amplitude on the flat portion of the square wave, call this
Vin. Also get the amplitude of the cell response at the same time, call this vpeak. Don't forget to divide v by 101. Then
Rm = (cell voltage)/ (input current) = vpeak /(Vin/Rc)
- Rearrange the formula above for the time couse of v into a linear plot,
v - (Vin/Rc)*Rm = (Vin/Rc)*Rm *(-exp(-t*a)) or
log(1 - v/vpeak) = -t*a
then plot this function over the inutial portion of the range given by the white line in the above image. The slope=-1/(time constant). You may need to limit the time span of the plot to a few milliseconds to avoid nasty numerical problems.
Assignment
- Modify simpleAI.m to acquire about 1 sec of data at 5000 Hz sampling rate. Acquire two channels from the USB-6008 consisting of the output from the function generator and the voltage inside the model cell. Plot the data so that you can visually check both channels.
- After acquiring the data, further modify the program to automatically perform the computation described the procedure section above to obtain the time constant and cell resistance.
- Modify the model cell by changing the
Rm to 30 Kohms and redo the analysis.
- Modify the model cell by changing the
Cm to 0.5 uf and redo the analysis.
Your written lab report should include:
- Your implementation of the math described here.
- Your program
- Screen shots of the analysis steps.
- Extimates of the cell time constant and cell input resistance. Compare the measured values with computed values based on all the component values you used for the model cell.
June 2007 Copyright Cornell university