- The Capture button starts the ginput function to collect the number of points specified in the NumPts edit box. If the NumPts edit box contains anything which is not a number or contains a number less than 1, then an appropriate error dialog box must appear when this button is pushed. As each mouse-click occurs, the program should plot the new point.
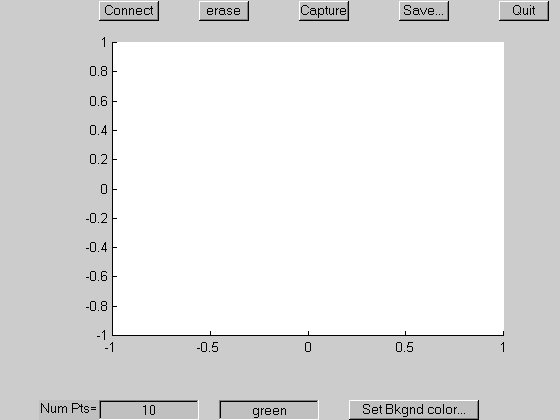
- The erase button erases the axes.
- The Connect button draws lines between the points collected by the capture button. If no points have yet been captured, pushing this button must cause an appropriate error dialog box to appear.
- The save button causes a uiputfile dialog box to appear. The x,y data which have been captured are stored to the file name specified in the dialog box. If no points have yet been captured, pushing this button must cause an appropriate error dialog box to appear.
- The NumPts edit field contains the number of points to be captured as mouse-clicks..
- The field to the right of it contains a string which will set the color of the line when the Connect button is pressed.
- The Set bkgnd color button causes a uisetcolor dialog box to appear.
After a color is chosen in the dialog box, the axes background color is
set to the new color. If the cancel button is pushed in the uisetcolor
dialog box, the axes color should not change.
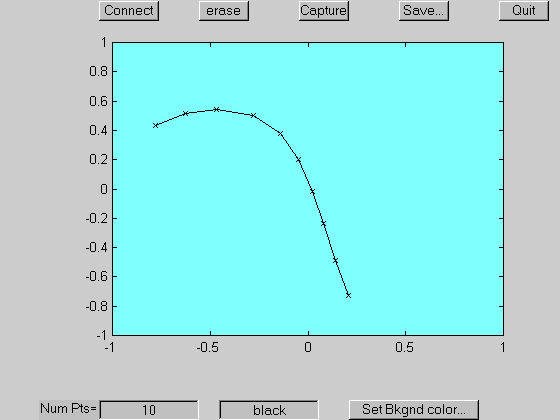
After a few points have been captured, the line color changed to black, and the background color changed to blue the figure might look like